
Stevens Visualization Lab
Our missionis to help people make sense of complex data. We combine methods from AI, data science, and human-computer interaction to develop interactive systems for data visualization and analysis.


What we do
We're recruiting PhD students for Fall 2027! Master's, undergraduate, and visiting scholars are also welcome to join the expedition. How to join →
Data is everywhere, and people need help making sense of it now more than ever!
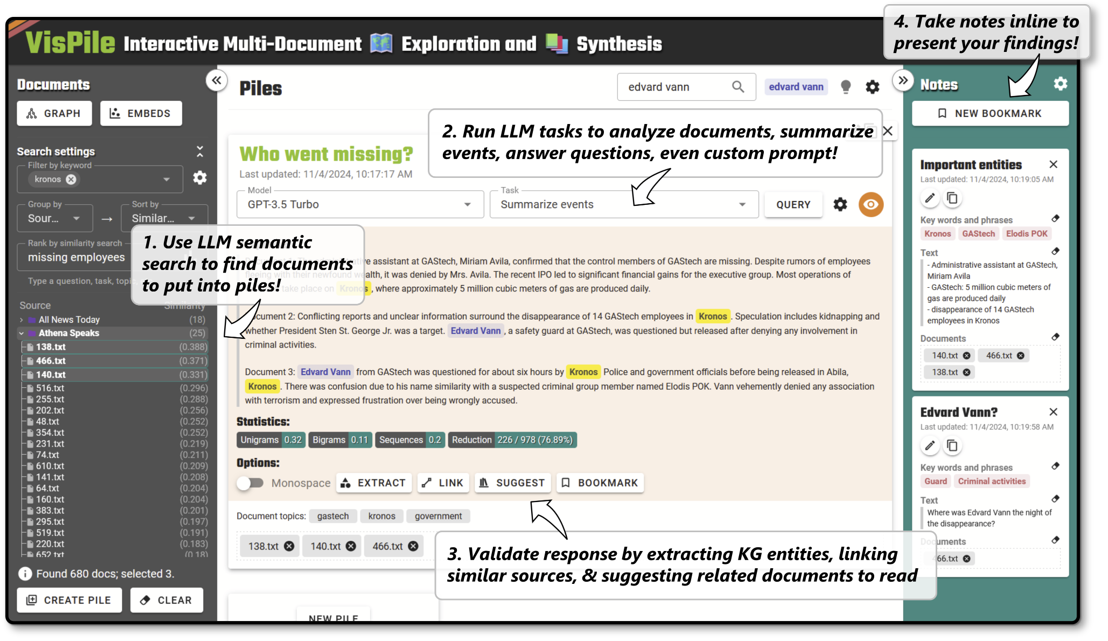
We have developed interactive systems for visualizing text documents, tabular data, and knowledge graphs, tackling hard problems in sensemaking, human-AI collaboration, and AI trustworthiness, with applications across education, data science, intelligence analysis, interactive machine learning, ocean science, and graphic design.
We are highly interdisciplinary! We demonstrate impact by engaging in iterative co-design and longitudinal field deployments with real domain experts. Our work contributes open-source software, empirical studies, and design guidelines to visualization, HCI, and AI communities.
Recent publications
All papers- Less Is More: Balancing Positive and Negative Space in Visual Concept BlendingUIST 2026
- Targeted and Traceable Investigation of Multi-Agent LLM Dialogue via Semantic Bundling of Knowledge GraphsVAST Challenge 2026 · ★ award
- DraftMarks: Enhancing Transparency in Human-AI Co-Writing Through Interactive Skeuomorphic Process TracesCHI 2026
- LLM Prompt Evaluation for Educational ApplicationsAIED 2025 Workshop
Research themes
Explore all papersVisualizations for Traceable and Defensible Human-AI Collaboration
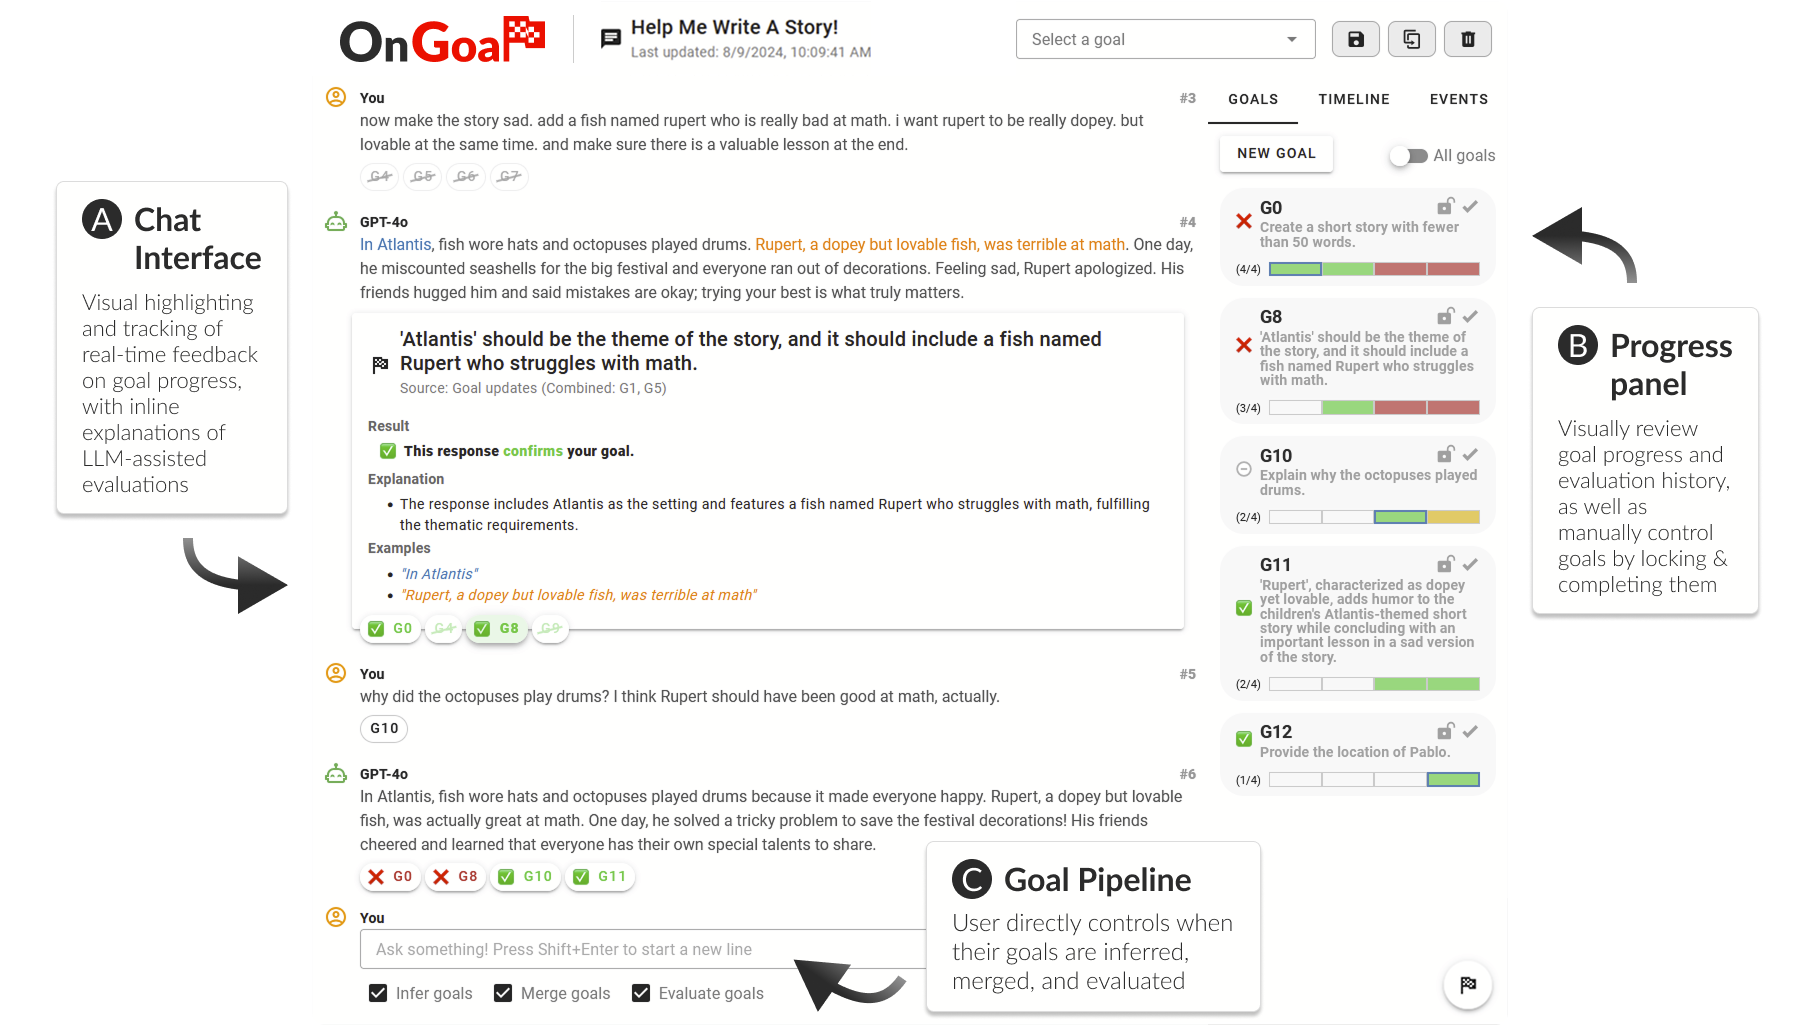
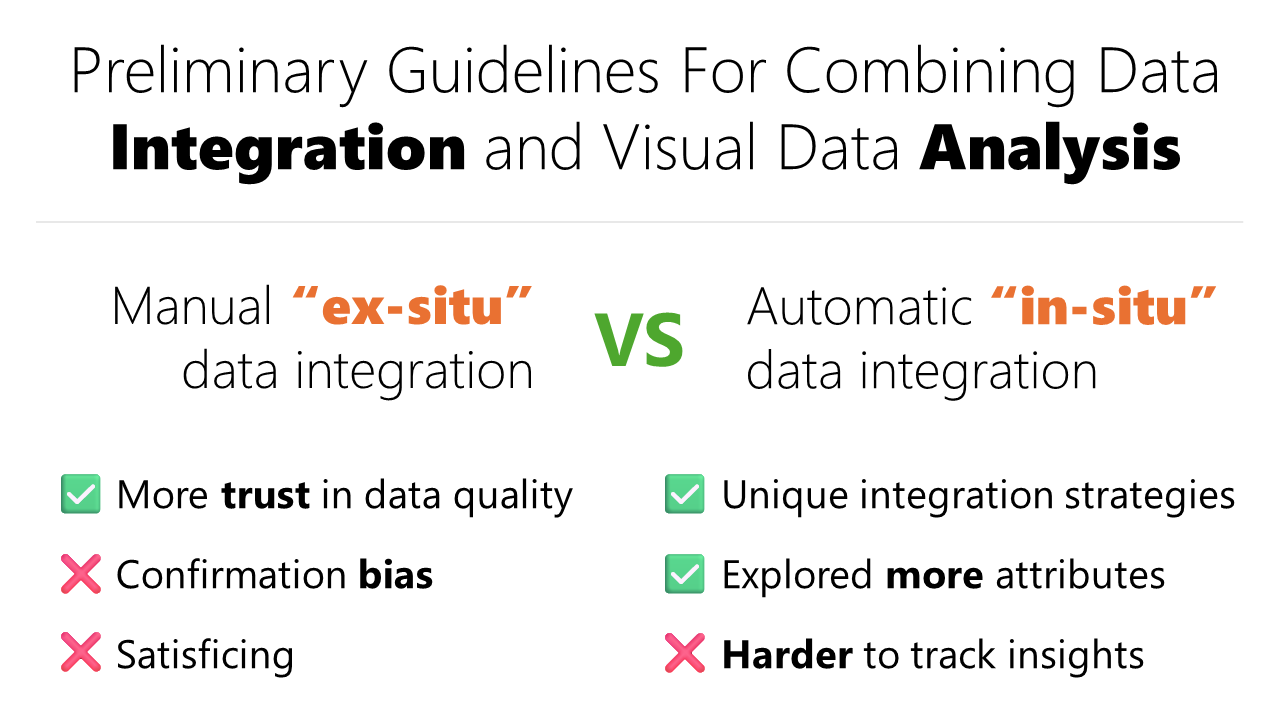
Today, people offload their data to AI to help them do their work. But when AI acts autonomously on text, graphs, and other data, it can produce insights that are unstructured, non-deterministic, untraceable, and may conflict with human insights, making it hard to know where results came from and who is responsible for them. Visual analytics can bridge this gap by tracing and visualizing the provenance of data operations and AI's reasoning process, helping people and AI communicate their goals, guide each other towards the right outcomes, and verify results against underlying data. We are exploring how to help people verify and steer AI reasoning against underlying data using interactive visualizations.
- Topics
- goal tracking · bi-directional communication · interactive reasoning · uncertainty · automated hypothesis testing · team-based collaboration
- Applications
- tabular data · text analysis · knowledge graphs · intelligence analysis · human-robot interaction · interactive machine learning
Selected projects
- Targeted and Traceable Investigation of Multi-Agent LLM Dialogue via Semantic Bundling of Knowledge GraphsVAST Challenge 2026 · ★ award

Making AI Trustworthy in Education Through Interactive Visualization
AI increasingly generates and manipulates data like grades, feedback, and lessons to help us learn and teach more efficiently. But learning is deeply tied to process, and today's learning technology struggles to integrate AI reasoning into pedagogy. Without evidence, teachers, engineers, and students can't tell whether or how AI is serving learning objectives, causing trust to break down. Visual analytics can surface where, how, and why data was generated and manipulated against learning objectives, making the process of human-AI learning more transparent. We are applying this idea to help engineers measure the pedagogical alignment of AI, help instructors assess and adjust the learning process in AI-based learning settings, and help learners self-correct behaviors by viewing their own personal interaction data with AI.
- Topics
- measuring trustworthiness · responsive pedagogy · personal data tracking · self-reflection · adaptive reading/writing
- Applications
- learning engineering · learning analytics · self-directed learning · interactive machine learning
Selected projects
- DraftMarks: Enhancing Transparency in Human-AI Co-Writing Through Interactive Skeuomorphic Process TracesCHI 2026
- Visualizing Intelligent Tutor Interactions for Responsive PedagogyAVI 2024
Visual Analytics for Expert-Driven Scientific Discovery
Scientific data is often sparse, expensive to collect, and spread across space, time, and other variables at once. Experts need tools that can help them extract patterns and value from these rich yet sparse datasets. Visual analytics can bring these measurements together in coordinated, multidimensional views, while using AI to help experts ground their exploration in testable lines of inquiry and hypotheses. We are co-designing interactive systems with scientists in the field to help them explore their data, form hypotheses, and decide where to sample next.
- Topics
- multidimensional visualization · spatial and 3D data · automated hypothesis testing
- Applications
- ocean science · quantum computing · human-robot interaction
Bias-Aware Visual Analytics Using Interaction Traces
As people explore data, the choices they make about what to look at, filter, and compare can reflect unconscious biases that skew their conclusions, often without them realizing it. Today, this problem is further compounded by the influence of AI guidance. Visual analytics can capture interactions with data as traces and show them back to analysts in real time, making their own analytic behavior visible and comparable against the data they have yet to explore. We are studying how visualizing interaction traces can increase people's awareness of bias and help them reflect on and adjust how they analyze data.
- Topics
- interaction traces · analytic provenance · cognitive bias · mixed-initiative guidance
- Applications
- tabular data · visual data exploration · decision-making


People
Meet the fellowship
Courses
CS 538Data VisualizationSpring 2027 · Lecture · Graduate, senior undergraduate
Data increasingly shapes decisions all around us, from tracking disease outbreaks and forecasting elections, to mapping connections in criminal investigations, monitoring network security threats, and helping consumers choose what to buy. Data visualization is a multi-disciplinary area of research that helps people analyze and understand data at scale. Drawing on human-computer interaction, data science, psychology, and machine learning, data visualizations turn complex calculations into visual patterns we can quickly interpret, improving human comprehension, memory, and decision-making. This course introduces the theoretical foundations and practical techniques for transforming data into visualizations that support analysis, communication, and decision-making. Students will study graphical perception, visual encoding, and interaction design, while exploring applications across domains such as social networks, geospatial data, business intelligence, and scientific data. Through hands-on assignments and a final project, students will design, build, and critically evaluate interactive visualization systems.